Tips & Tricks#
This page provides helpful tips for using Scout services effectively.
Analytics (Superset)#
Query Performance#
Use partitioned columns: Filter on the
yearcolumn (derived frommessage_dt) for better query performanceLimit result sets: Add
LIMITclauses to large queries during explorationLeverage Delta Lake columnar format: Select only the columns you need rather than
SELECT *Use SQL Lab for testing: Test and refine queries in SQL Lab before creating visualizations
Creating Dashboards#
Start with the Scout Dashboard: The pre-built Scout Dashboard provides a good template for creating custom dashboards
Use filters: Add dashboard-level filters to make dashboards more interactive
Save queries as datasets: Complex queries can be saved as virtual datasets for reuse across multiple charts
Chat#
Getting Better Results#
Be specific: Include details like modality, date ranges, or specific fields in your questions
Use Scout terminology: Reference field names from the data schema for more accurate queries
Check the SQL: Expand the “View Result from scout-db” section to verify the AI generated the correct query
Iterate: Ask follow-up questions to refine results
When to Use Chat vs. Analytics vs. Notebooks#
Use Chat for: Quick exploratory questions, ad-hoc analysis, learning about the data
Use Analytics for: Creating visualizations, building dashboards, sharing results with others
Use Notebooks for: Complex transformations, statistical analysis, machine learning, custom exports
Notebooks (JupyterHub)#
Query Best Practices#
Filter early: Apply
WHEREclauses as narrowly as possible so Trino’s pushdown limits the scanPartition on
year: All report tables partition by year —WHERE year = 2024prunes whole files, much faster than arequested_dtrangeUse array functions: Filter array columns with
any_match:pd.read_sql(""" SELECT accession_number, diagnoses FROM reports_latest_epic_view WHERE any_match(diagnoses, x -> x.diagnosis_code = 'J18.9') """, engine)Leverage convenience columns: Use
resolved_epic_mrn(orresolved_mpi) on the_epic_viewviews or dynamically-created ID columns instead of parsingpatient_idsarray
Installing Additional Packages#
The base Jupyter environment includes Trino client, pandas, matplotlib, seaborn, scikit-learn, statsmodels, pyarrow, and other core data analysis packages. For ML, NLP, or other specialized libraries, create a conda environment:
# Create an environment with specific packages
mamba create -n my-env python=3.11 ipykernel pytorch transformers scikit-learn -y

# Or use the sample environment file (in ~/Scout/environment.yml)
mamba env create -f ~/Scout/environment.yml
Environments are stored on your persistent home directory (/home/jovyan/.conda/envs/) and survive server restarts. The nb_conda_kernels extension automatically discovers them as Jupyter kernels – after creating an environment, refresh the launcher to see it.
Important
Every environment you create must include ipykernel for nb_conda_kernels to discover it as a kernel. Without it, the environment won’t appear in the Jupyter launcher.
Note
In air-gapped deployments, package requests are routed through a proxy transparently – no extra configuration is needed.
Working with Report Sections#
The Delta Lake schema includes parsed report sections:
report_section_findingsreport_section_impressionreport_section_addendumreport_section_technician_note
Use these for targeted text analysis instead of parsing report_text.
Saving Intermediate Results#
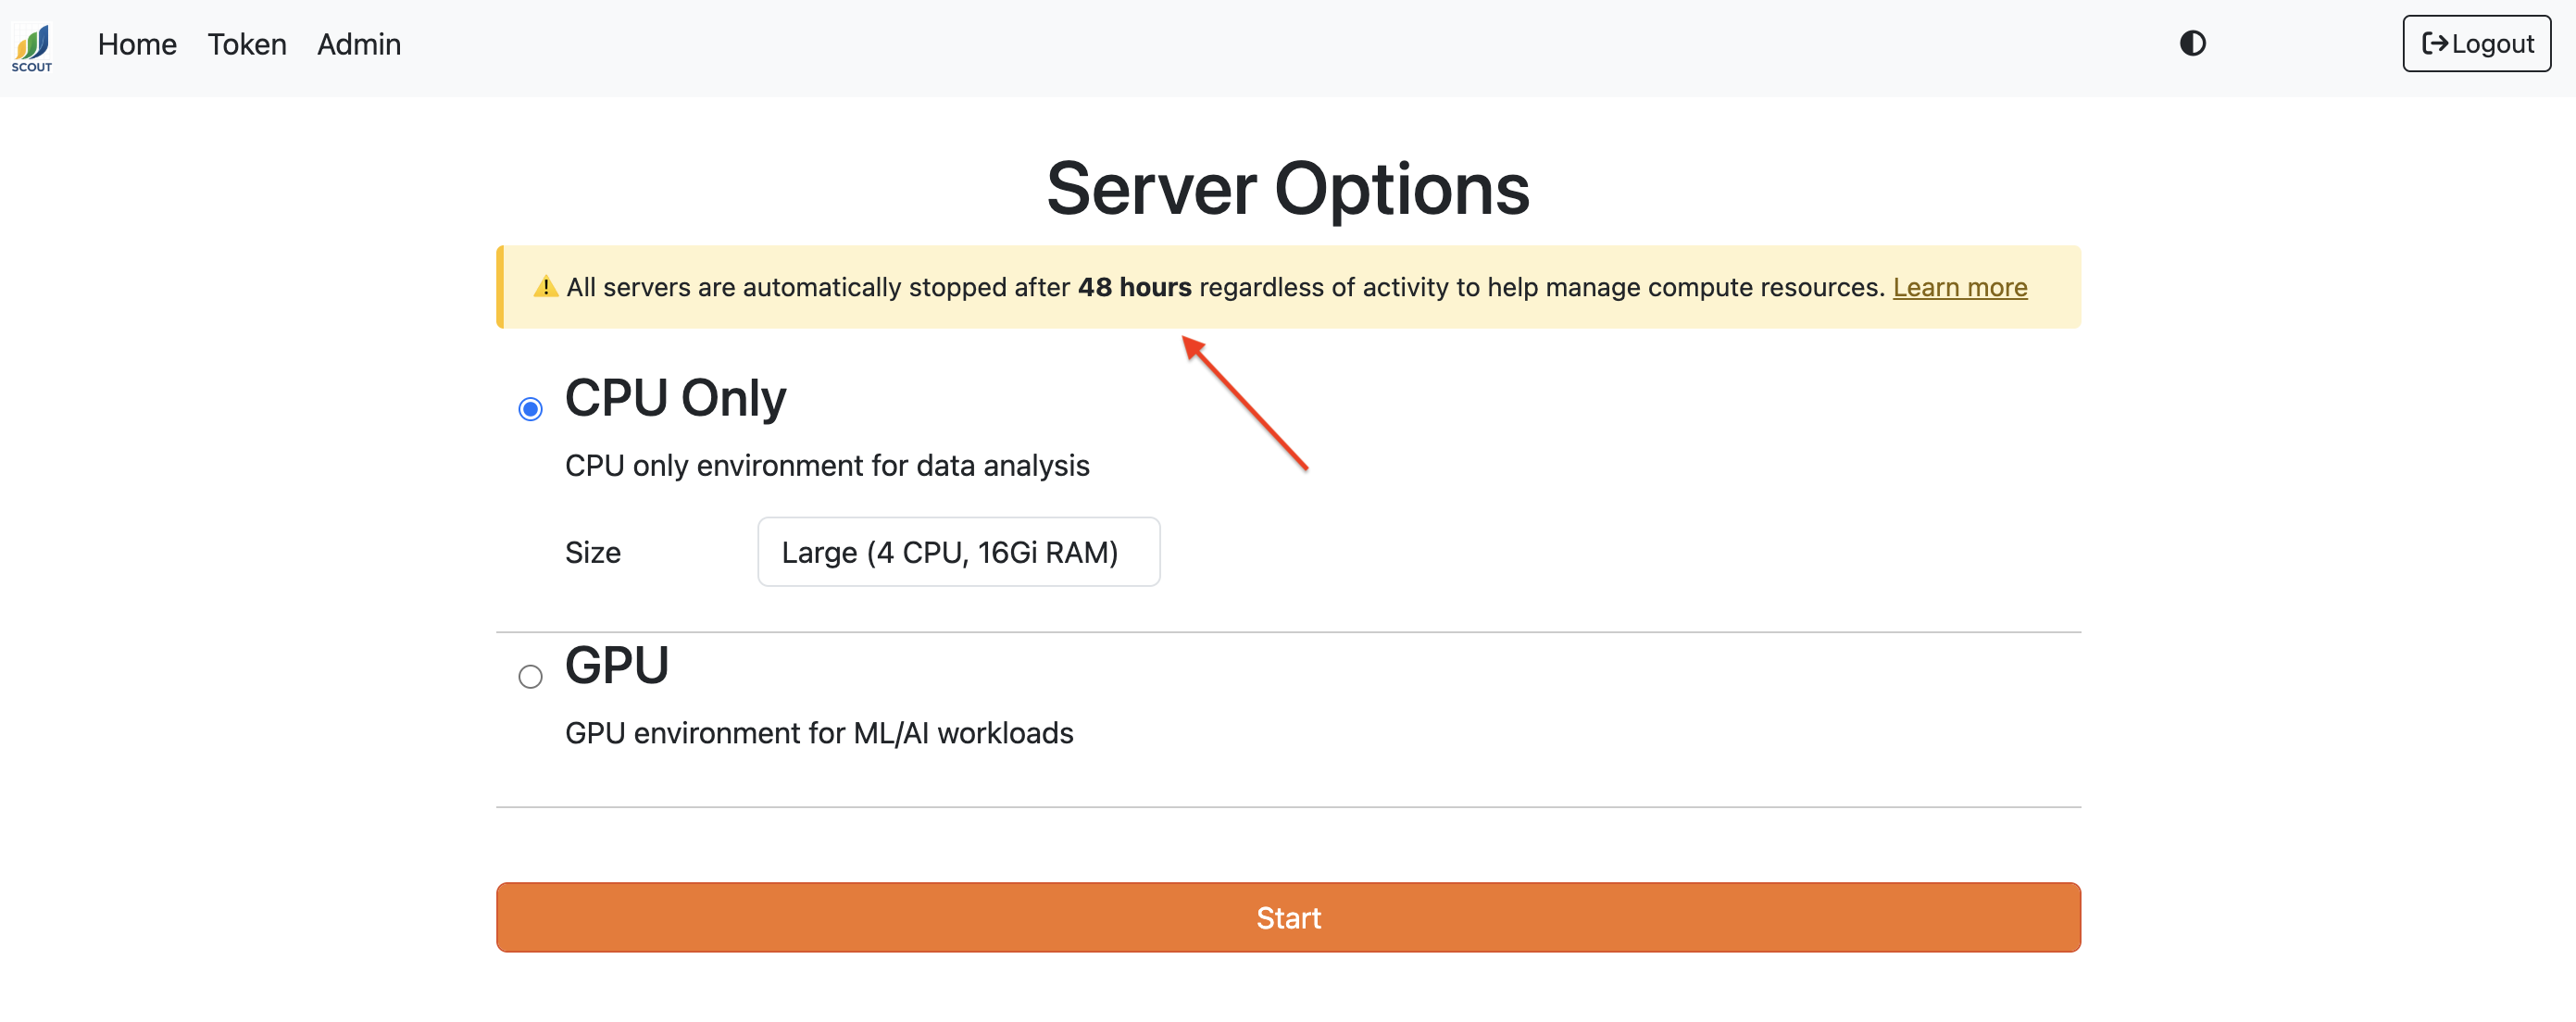
Jupyter notebook servers automatically shut down after a configurable period of runtime (2 days by default). You’ll see the specific timeout for your deployment displayed in a notification banner when you start your server:
Your notebook files and home directory (/home/jovyan/) persist, but in-memory variables are lost. To avoid potentially losing any important work, save notebooks frequently (Ctrl+S / Cmd+S) and save large DataFrames and intermediate results to disk.
Pandas DataFrames:
# CSV (human-readable)
df.to_csv('/home/jovyan/checkpoints/results.csv', index=False)
df = pd.read_csv('/home/jovyan/checkpoints/results.csv')

# Parquet (faster, preserves types)
df.to_parquet('/home/jovyan/checkpoints/results.parquet')
df = pd.read_parquet('/home/jovyan/checkpoints/results.parquet')
Python objects (pickle):
import pickle

# Save any Python object
with open('/home/jovyan/checkpoints/my_data.pkl', 'wb') as f:
    pickle.dump({'results': results, 'config': config}, f)

# Load it back
with open('/home/jovyan/checkpoints/my_data.pkl', 'rb') as f:
    data = pickle.load(f)
ML models:
# scikit-learn
import joblib
joblib.dump(model, '/home/jovyan/models/classifier.joblib')
model = joblib.load('/home/jovyan/models/classifier.joblib')

# PyTorch
torch.save(model.state_dict(), '/home/jovyan/models/checkpoint.pth')
model.load_state_dict(torch.load('/home/jovyan/models/checkpoint.pth'))
Monitor (Grafana)#
Viewing Dashboards and Logs#
Accessing Scout Dashboards: Navigate to Dashboards > Scout in Grafana
Accessing Service Logs: Go to Drilldown > Logs section or use Explore > Loki
Adjust Time Ranges: Modify the time range to focus on specific periods. Services without activity during the selected time range will not appear
Click on Legends: Click legend entries to isolate specific metrics or log entry types (e.g., filter to only errors)
Dashboard Variables#
Many dashboards include variables (namespace, node, pod, etc.) at the top
Use these to filter data for targeted analysis
Multiple selections are often supported
Correlating Logs Across Services#
To view logs from multiple services in a single view:
In the Logs panel, select “Include” for each service you want to view
Click “Show Logs”
Search, filter, and identify patterns across services
This is especially useful for debugging issues that span multiple components.
Disk Usage Monitoring#
Kubernetes PV/PVC Metrics: May not work in on-premises deployments
Alternative: Use the Node Exporter dashboard to monitor disk usage for each node and mount point
Saving Dashboard Changes#
Provisioned dashboards (in Dashboards > Scout) cannot be modified directly in Grafana
To make changes:
Save the dashboard as a new one with a different name
Make your modifications
Export the updated JSON
(Admins) Update the dashboard configuration in the Scout repository for future deployments
General Tips#
Keyboard Shortcuts#
Superset SQL Lab:
Ctrl/Cmd + Enter: Run queryCtrl/Cmd + Shift + Enter: Run selected text
JupyterHub:
Shift + Enter: Run cell and move to nextCtrl + Enter: Run cell and stayEscthenA: Insert cell aboveEscthenB: Insert cell below
Exporting Data#
From Analytics: Click Export in query results (CSV, Excel, etc.)
From Chat: Copy data from chat responses, or use the SQL query in Analytics/Notebooks for larger exports
From Notebooks: Use
df.to_csv(),df.to_parquet(), or other pandas export methods on the result ofpd.read_sql(...)
Getting Help#
Documentation: Review the data schema, services, and ingestion docs
Issue Tracking: Report bugs or request features via Jira
Admin Tools: Contact your Scout administrator for access to Monitor, Orchestrator, or User Management interfaces