Services#
Scout consists of several services that work together to process medical imaging data into a data lake and provide user interfaces for accessing and analyzing the data.
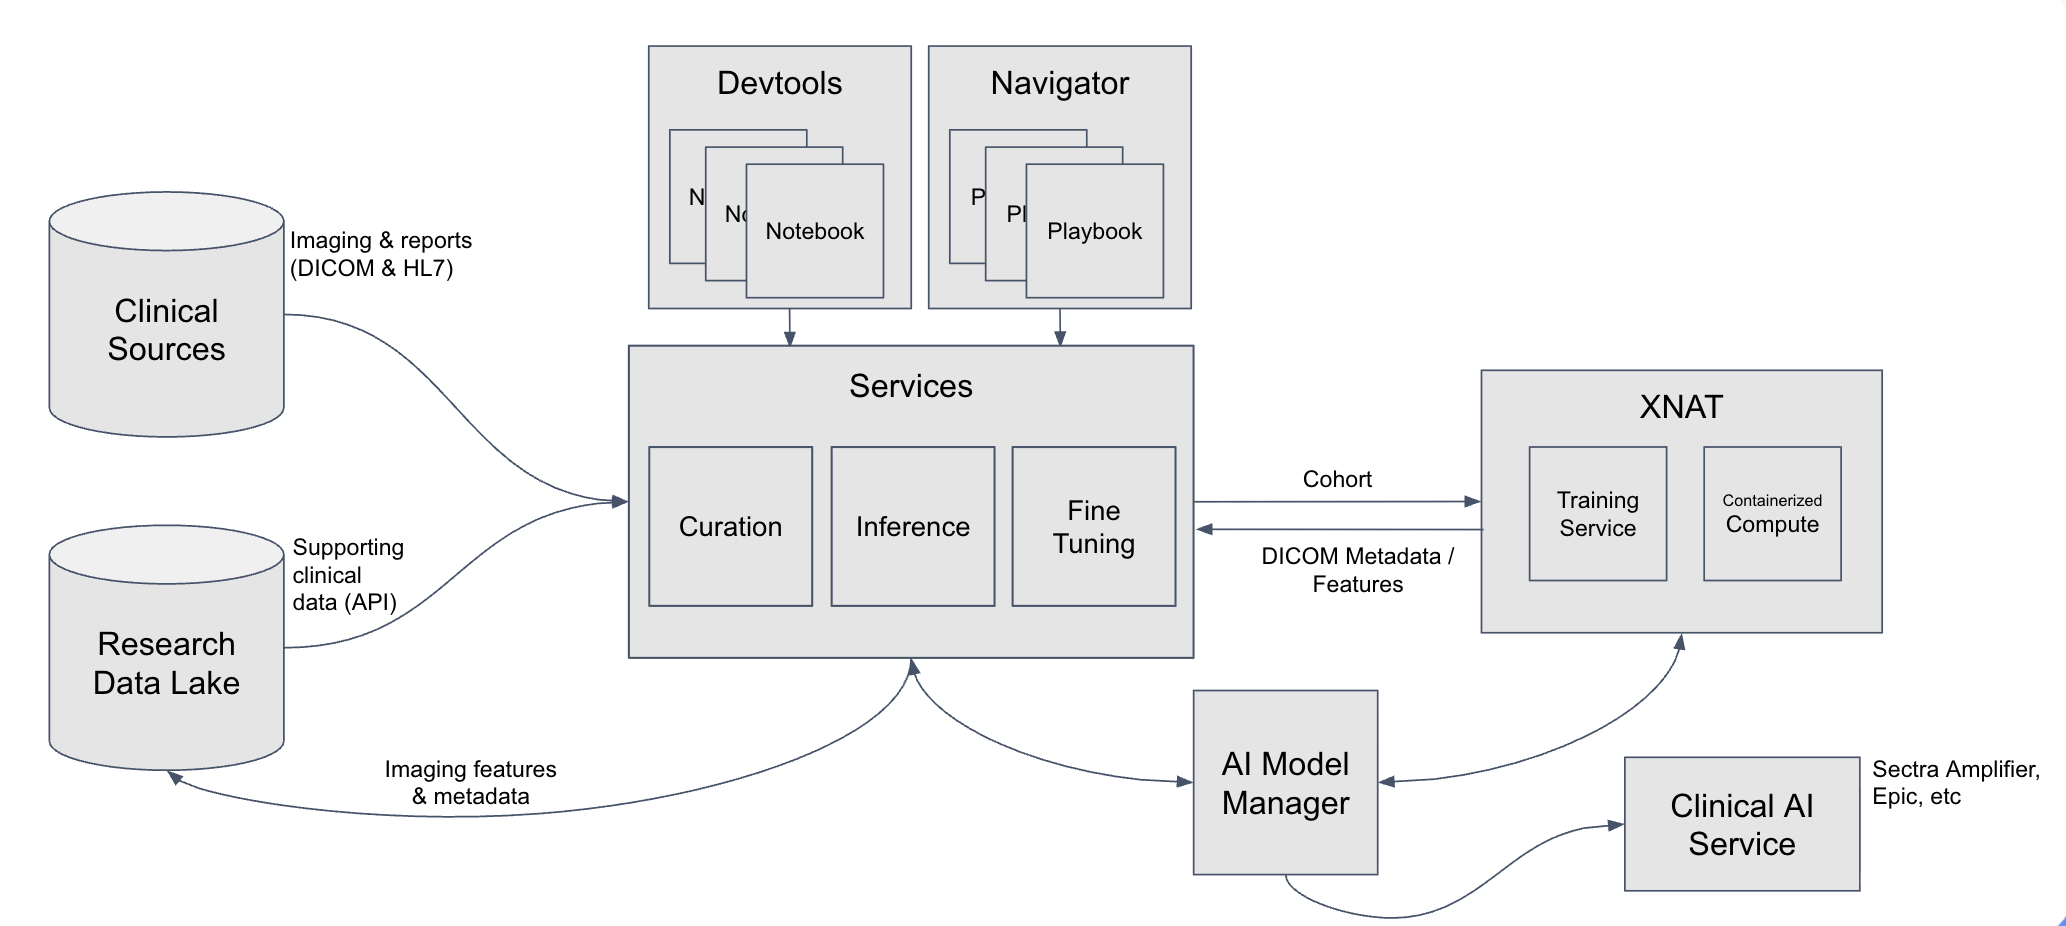
Current version: Scout currently ingests HL7 radiology reports. Future versions will incorporate DICOM metadata, pathology reports, and extracted features in concert with XNAT.
Architecture#
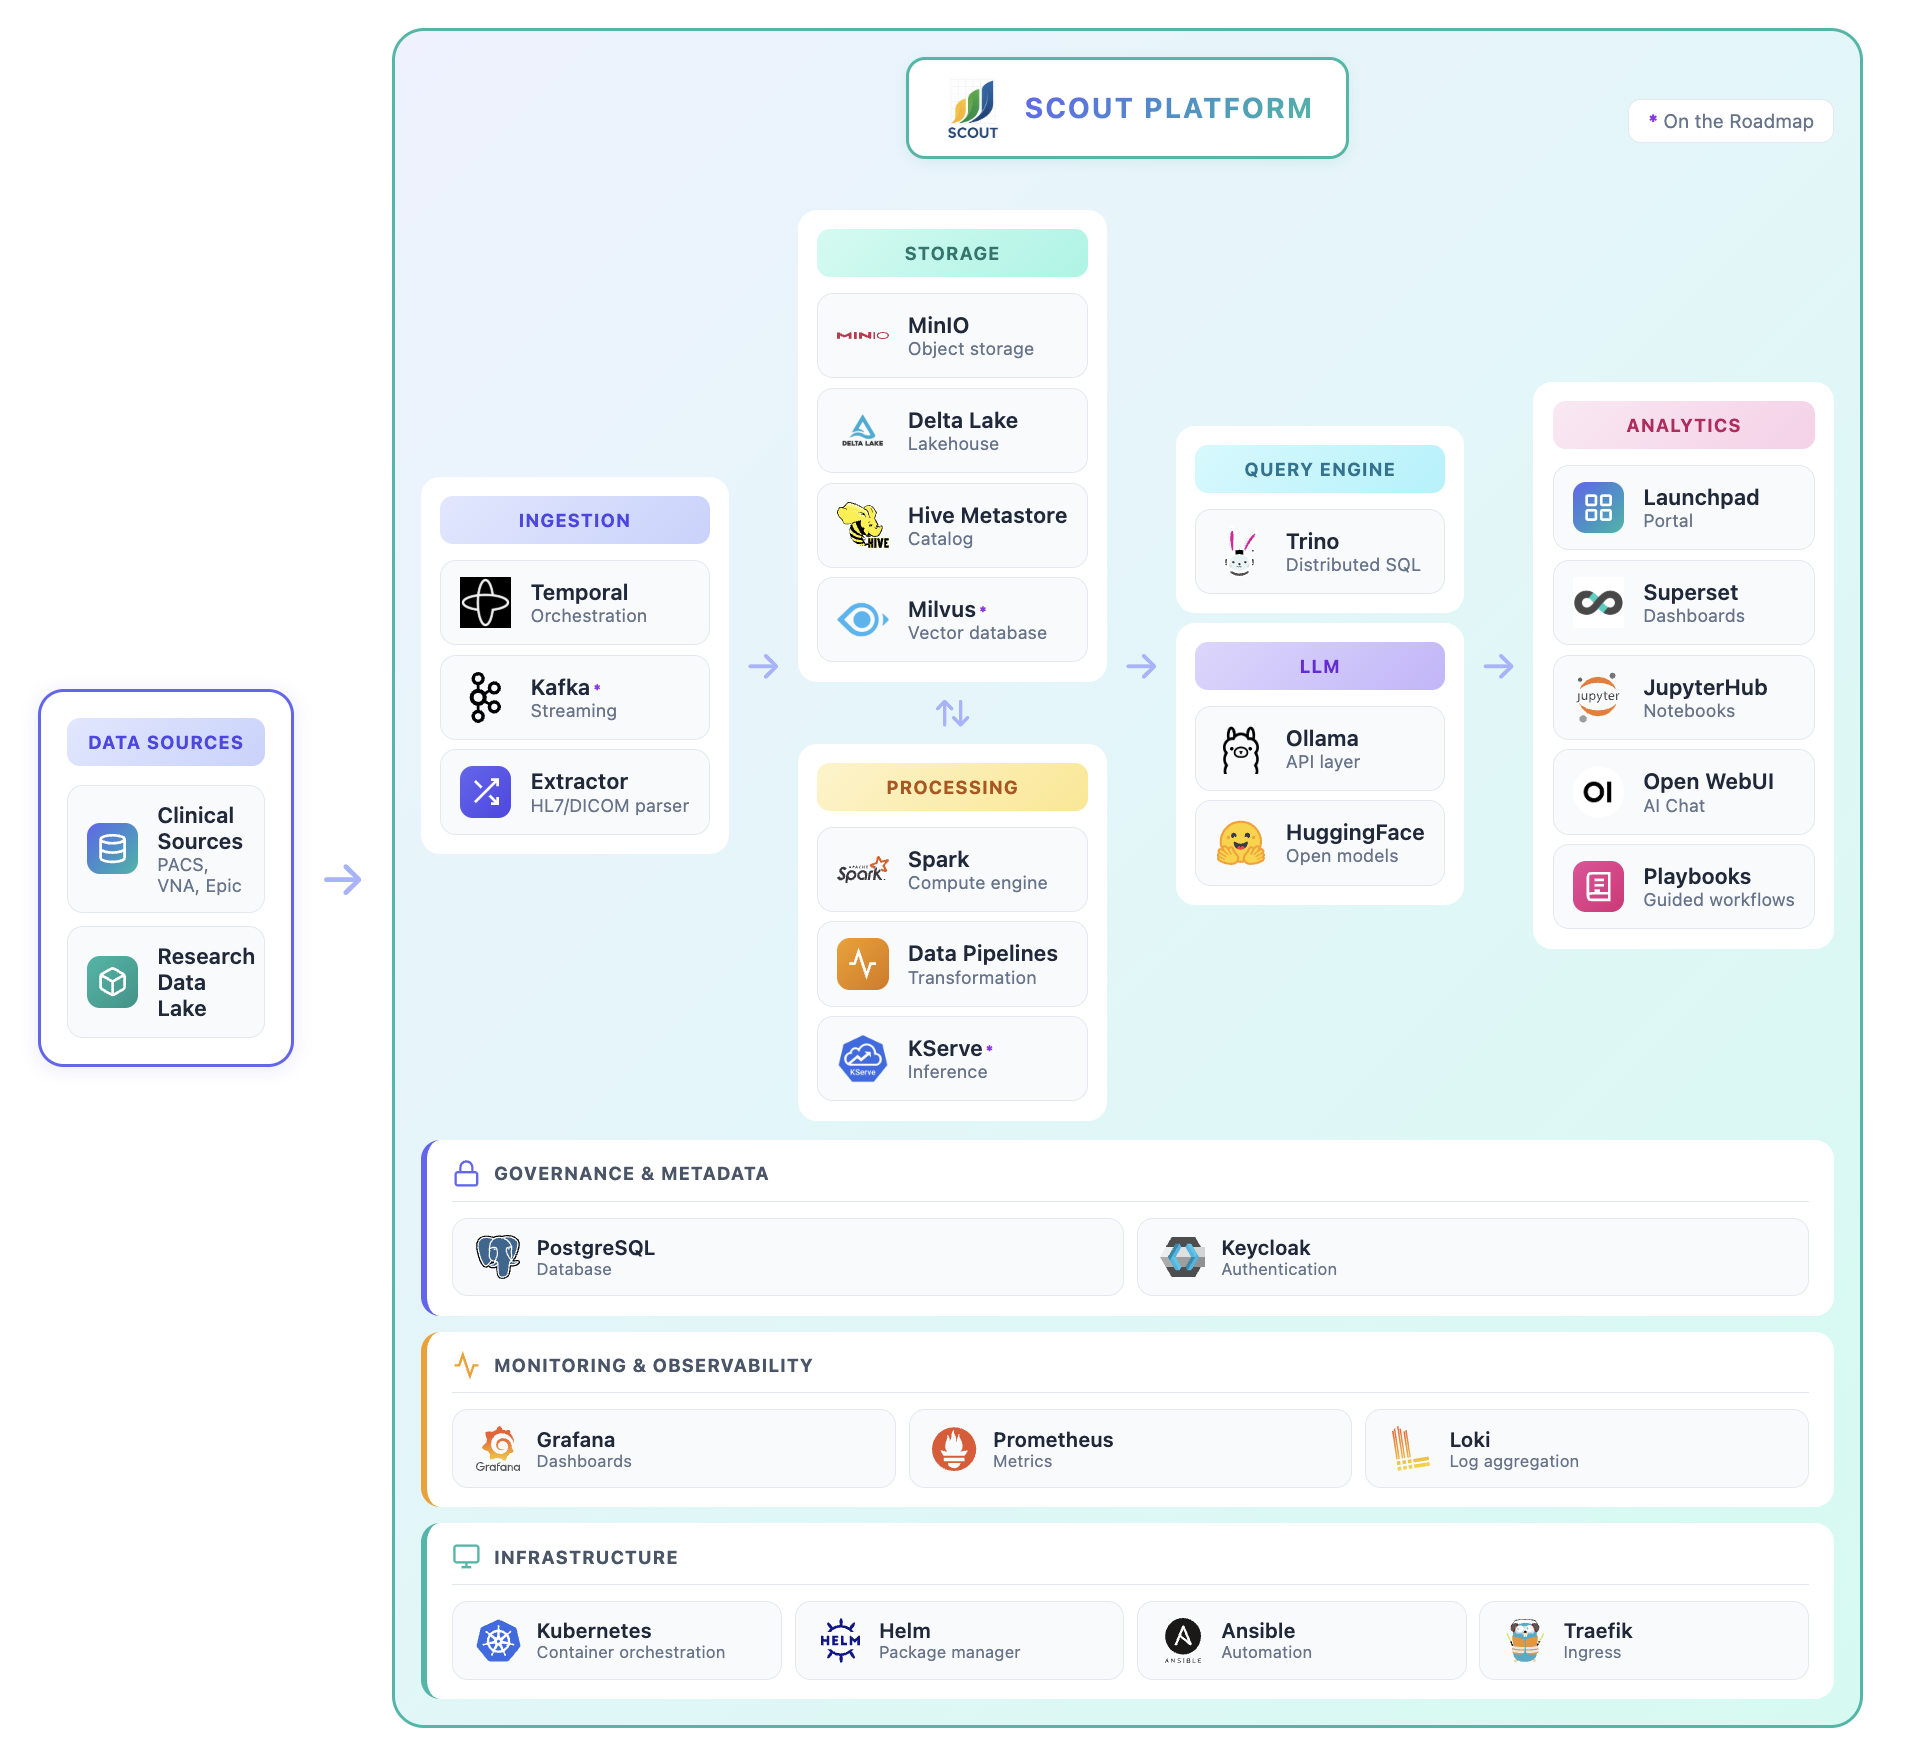
Scout is a modern, distributed data platform deployed on Kubernetes.
User Services#
Scout provides three primary user-facing services for data exploration and analysis. These are accessible from the Scout Launchpad after authentication.
Analytics#
Apache Superset provides a user-friendly interface for exploring and visualizing data in the Scout data lake. Superset offers two main approaches:
No-code visualization builder: Create interactive charts, graphs, and dashboards without writing SQL
SQL Lab: An integrated SQL IDE for advanced queries and data exploration
Under the hood, Superset queries the data lake using Trino, a distributed SQL query engine that provides fast, efficient access to large datasets stored in Delta Lake.
Key Features:
Pre-built Scout Dashboard with overview metrics
Interactive visualizations (charts, tables, pivot tables, etc.)
Direct SQL querying with autocomplete
Export results to CSV, Excel, or other formats
Share dashboards with other users
Learn more: Superset documentation
Chat#
Open WebUI with Ollama provides an AI-powered chat interface for natural language querying of data in the Scout data lake. Ask questions in plain English and receive data-driven answers from large language models with direct access to the Delta Lake.
The Chat service is configured with:
Natural language SQL: Automatically converts your questions into SQL queries
Trino MCP integration: Direct access to the Delta Lake for real-time data retrieval
Context-aware responses: The AI understands the Scout data schema and can provide detailed analyses
Example queries (for radiology reports in the current version):
“How many CT scans were performed in 2024?”
“What are the most common diagnoses in chest X-rays?”
“Show me the age distribution of patients with MRI reports”
Note: The Chat service is optional and may not be enabled in all Scout deployments. For detailed information about using the Chat interface, see the Chat documentation.
Notebooks#
JupyterHub provides an interface for power users to perform custom data analysis using Python code. Each user receives their own single-user Jupyter notebook environment with full access to data in the Scout data lake.
Key Features:
SQL access to the data lake via Trino, with results loaded as pandas DataFrames
Example
Scout/Quickstart.ipynbnotebook with sample queries and analysis code for radiology reportsExport results to CSV, JSON, Parquet, or other formats
Create custom visualizations and statistical analyses
Use cases:
Complex data transformations and aggregations
Statistical analysis and machine learning
Custom report generation
Data quality checks and validation
Important: Notebook servers automatically shut down after a period of time (default: 2 days, configurable by your
deployment) to conserve resources. Your files in /home/jovyan/ are preserved, but in-memory variables (DataFrames,
models, etc.) are lost. Save your work regularly and checkpoint intermediate results. See Tips & Tricks
for checkpointing strategies.
Backend Services#
The following services support Scout’s data processing, storage, and monitoring infrastructure. Administrators can access these services from the Admin Tools section of the Scout Launchpad.
Orchestrator#
Temporal is a workflow orchestration platform that manages the execution of data ingestion workflows. Temporal ensures reliable, fault-tolerant processing of HL7 reports from log files into the data lake.
Key responsibilities:
Coordinate Extractor service activities
Retry failed operations automatically
Track workflow execution history and status
Provide visibility into data ingestion progress
Access: Administrators can monitor workflows and view execution details through the Temporal Web UI.
Learn more: See Report Ingestion for details on launching and monitoring ingestion workflows.
Extractor#
Extractor services are responsible for extracting data from source systems and loading them into the data lake. Scout uses a two-stage medallion architecture:
Current implementation: The HL7 extractor processes radiology reports from hospital information systems.
HL7 Log Extractor (Bronze Layer)
Parses daily HL7 log files exported from hospital systems
Splits log files into individual HL7 messages
Uploads raw HL7 messages to MinIO object storage
HL7 Transformer (Silver Layer)
Parses HL7 message structure using Python
Transforms HL7 fields into structured columns (see Data Schema)
Writes transformed data to Delta Lake using PySpark
Monitoring: Administrators can monitor extractor performance using:
Grafana HL7 Ingest Dashboard: Metrics, status, and performance graphs
Grafana Logs: Detailed log entries for debugging (Drilldown > Logs)
Temporal UI: Live view of running workflows and activity execution
Lake#
The Lake service provides the data storage foundation for Scout using a medallion architecture:
Bronze Layer: Raw HL7 messages stored as-is in object storage
Silver Layer: Structured, queryable data transformed into the Scout Data Schema
Technology stack:
MinIO: S3-compatible distributed object storage for data persistence
Delta Lake: Lakehouse storage format providing ACID transactions, versioning, and time travel
Hive Metastore: Centralized metadata catalog for table schemas and partitions
Trino: Distributed SQL query engine connecting user services (Superset, Notebooks, Chat) to the data lake
Access: Administrators can access the MinIO web console to view buckets, objects, and storage metrics.
Monitor#
Grafana provides comprehensive monitoring and observability for the Scout platform. Administrators can track system performance, view metrics, and troubleshoot issues through pre-configured dashboards and log aggregation.
Pre-configured dashboards:
Scout HL7 Ingest: Extractor performance, ingestion rates, and errors
Kubernetes: Cluster health, node resources, and pod status
Temporal: Workflow execution metrics and task queue status
MinIO: Storage usage and API performance
Database: PostgreSQL and Cassandra metrics
Log aggregation:
All service logs collected by Loki
Searchable and filterable in Grafana Explore
Correlate logs across services for debugging
Access: Administrators can access Grafana through the Scout Launchpad Admin Tools section.
Learn more: See Tips & Tricks for guidance on using Grafana dashboards effectively.
User Management#
Keycloak provides identity and access management for Scout. It handles authentication, user registration, and role-based access control for all Scout services.
Key features:
Single sign-on (SSO) across all Scout services
Integration with institutional identity providers (SAML, OIDC)
User registration with administrator approval workflow
Role-based access control (admin vs. regular users)
Access: Administrators can manage users, roles, and authentication settings through the Keycloak admin console.
Learn more: See Authentication for details on the user login and approval process.